
System Dashboard
System Dashboard is a read-only operational view of the IMS client, PostgreSQL server, high-availability cluster, active connections, recent workstations, access information and recorded transaction performance.
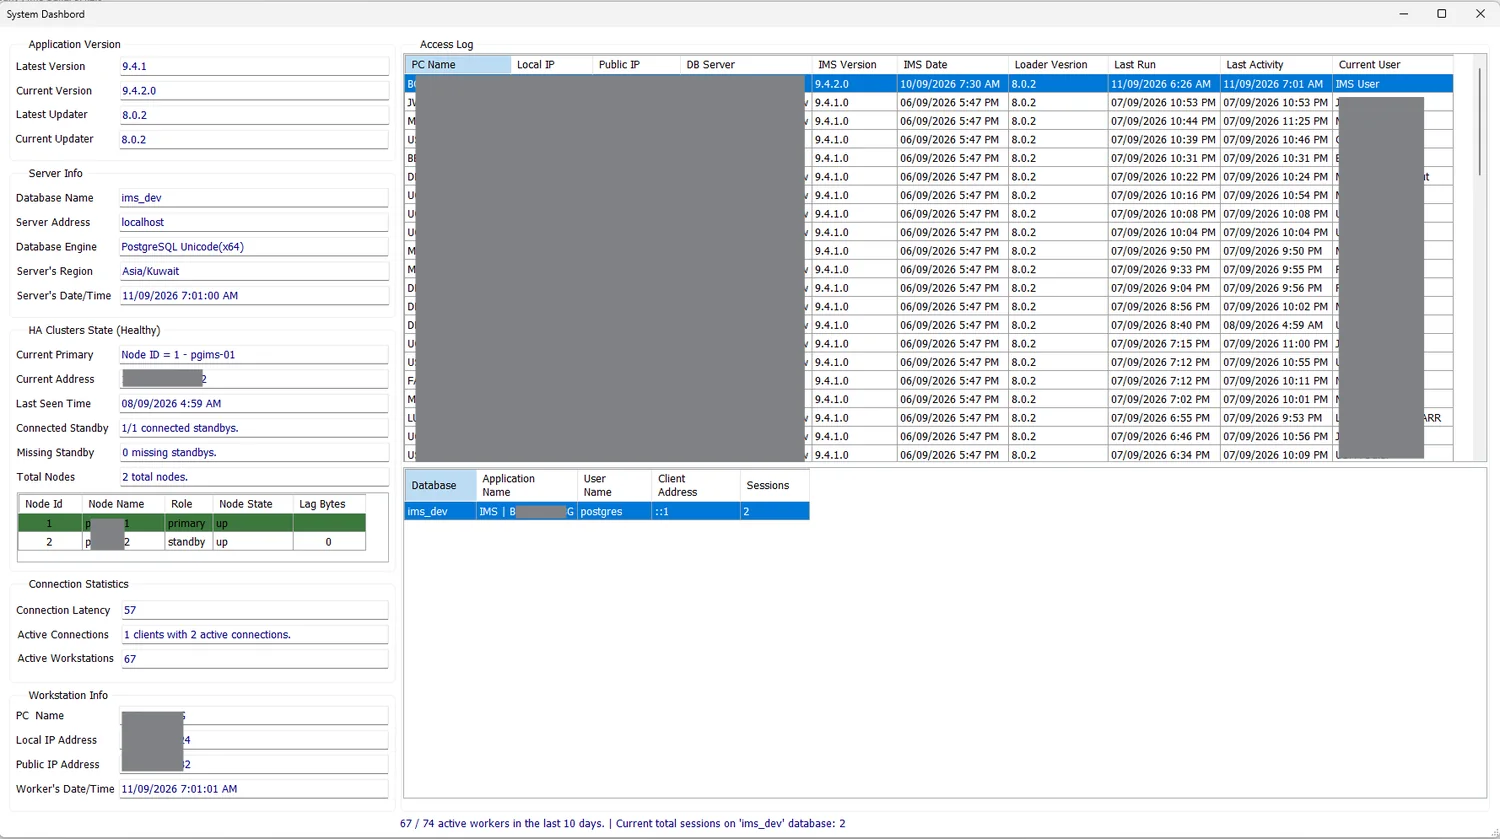
Application Version
| Field | Meaning |
|---|---|
| Latest Version | The latest IMS application version recorded in IMS Global. |
| Current Version | The version of the IMS executable currently running on this workstation. |
| Latest Updater | The latest updater/loader version recorded in IMS Global. |
| Current Updater | The file version of the local Update.exe. |
Server Info
Server Info identifies the database environment used by the current IMS session.
| Field | Meaning |
|---|---|
| Database Name | The active IMS database. |
| Server Address | The database-server address used by the active connection. |
| Database Engine | The configured database engine; IMS identifies PostgreSQL when no more specific engine description is supplied. |
| Server's Region | The configured IMS/database time zone. |
| Server's Date/Time | The current server-side date and time known to IMS. |
HA Cluster State
When the IMS HA monitoring tables are available, the dashboard displays the current cluster state and node information maintained under ims_admin.
| Field | Meaning |
|---|---|
| Current Primary | The node ID and name currently reported as primary. |
| Current Address | The current primary host and PostgreSQL port. |
| Last Seen Time | The last time the cluster-status record was refreshed. |
| Connected Standby | Number of connected standby nodes compared with the configured standby count. |
| Missing Standby | Number of standby nodes currently reported missing. |
| Total Nodes | Total number of nodes in the monitored cluster. |
The node grid shows Node ID, Node Name, Role, Node State and Lag Bytes. Primary nodes are visually highlighted to make the current role easy to identify.
Connection Statistics
| Metric | Meaning |
|---|---|
| Connection Latency | The query-response timing measured by IMS when the dashboard opens. |
| Active Connections | Summary of active IMS-related clients and their PostgreSQL connections. |
| Active Workstations | Distinct workstation PCs recorded in the Access Log during the last 10 days. |
Workstation Info
This section identifies the computer on which the dashboard is currently open: PC Name, Local IP Address, Public IP Address and the workstation's current date/time.
Access Log
The upper Access Log grid shows recent workstation/client information recorded by IMS:
| Column | Meaning |
|---|---|
| PC Name | Recorded workstation name. |
| Local IP / Public IP | Recorded network addresses for the workstation. |
| DB Server | Database server recorded for that workstation/session. |
| IMS Version / IMS Date | Application version and corresponding IMS build/date information recorded in the access entry. |
| Loader Version | Updater/loader version recorded for the workstation. |
| Last Run / Last Activity | Most recent run and activity timestamps recorded in the Access Log. |
| Current User | The most recently recorded IMS user for the workstation. |
Database Sessions
The lower grid summarizes live PostgreSQL sessions for the active IMS database, grouped by:
- Database
- Application Name
- User Name
- Client Address
- Sessions
The status line at the bottom combines the recent-workstation count with the current total PostgreSQL session count for the active database.
Performance Monitor
IMS 9.4.4 adds a transaction-performance grid to System Dashboard. It summarizes recorded transaction timings over a selected date range so administrators can compare Store/workstation performance without reading raw timing rows.
The default range is the last seven days through today. Choose From and To, optionally enable Trans. Type, then click Filter.
| Column | Meaning |
|---|---|
| Store Name | Store associated with the recorded transaction. |
| PC Name | Workstation that recorded the timing; blank workstation names are shown as Unknown. |
| Transaction | Shown only when Trans. Type is enabled. IMS uses the transaction-code description, or the code number when no description is available. |
| Min / Max / Avg. | Minimum, maximum and rounded average recorded transaction time in milliseconds for that group. |
| Health | Classification based on the average: Good ≤ 1,000 ms; Fair ≤ 2,000 ms; Slow ≤ 4,000 ms; Critical > 4,000 ms. |